Cross-filtering, or brushing, allows users to select hierarchies or member elements in one discovery to filter the content in the other discoveries by the selected hierarchies or member elements. Filtering applies where different hierarchies or member elements appear in the other discoveries on this slide.
Note: If the target discovery contains the selected hierarchy or element, the source selection is used to highlight the target instead of filtering it. For more information, see Cross-Highlighting at Runtime.
The following screen capture shows cross-filtering between visuals:
Scope of cross-filtering interactions
Data interactions enable cross-filtering between visuals when clicking on a data point or member element. If the selected data point or member element does not exist in both visuals, a filtering effect is applied.
- If the selected source data point or member element exists in the target visual also, the target visual is cross-highlighted instead of being cross-filtered. For more information, see Cross-Highlighting at Runtime.
- You can cross-filter by multiple data points using any of the multi-select options. This includes Lasso tools,
Ctrl+click, and the Multi-highlight mode (selected from the Present runtime menu). For more information, see Multi-select highlighting at Present Runtime. - Cross-filtering may apply across your presentation where your presentation designer has added targets to enable cross-slide interactions. Note that the effect is identical to cross-filtering within a slide, the only difference being that the source and target visuals appear in different slides.
Example: Filter Promotion Types
To filter multiple discoveries on a slide by hierarchies or member elements at runtime:
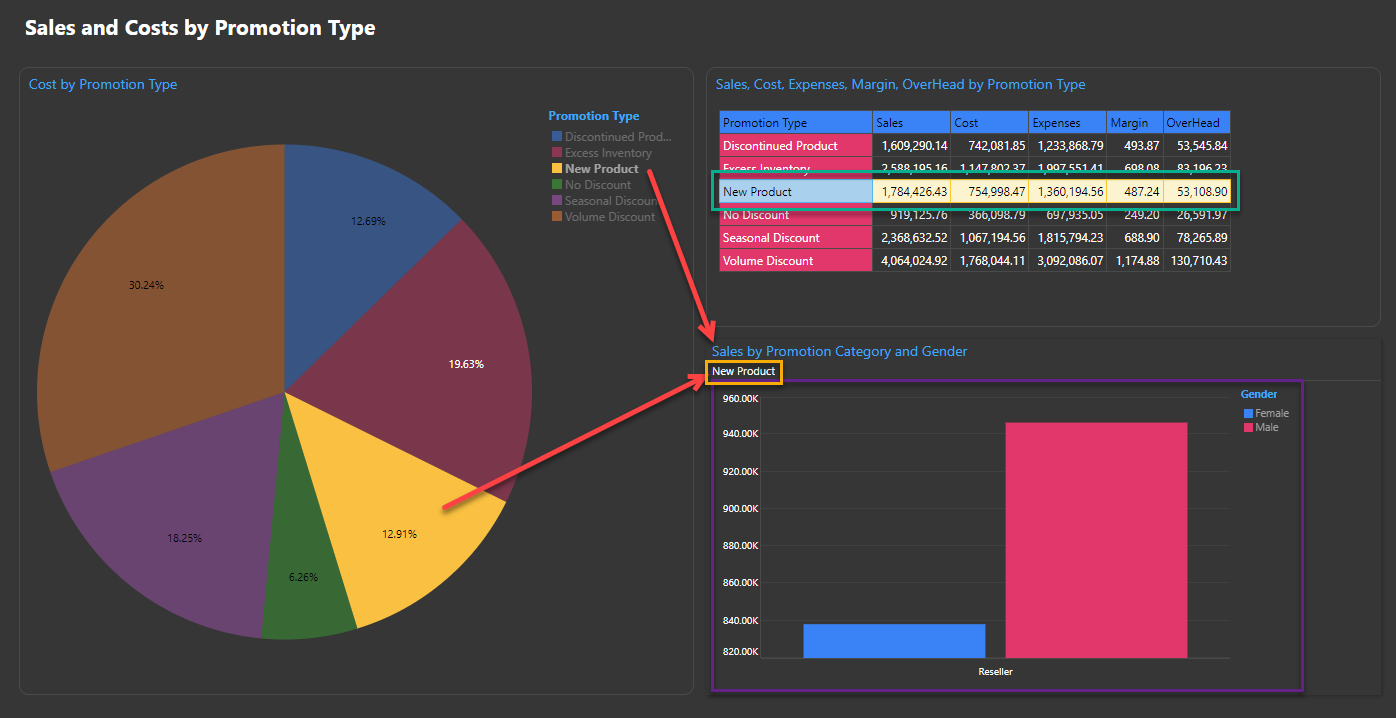
- Select the hierarchy or member element in the source discovery that you want to use to filter the target discovery. In the example case, you can select the New Product Promotion Type as in the previous example. Selecting this affects the column chart in the following ways:
- The breadcrumb trail (orange highlight), which indicates the filters that are applied, is updated to show the promotion type that is selected.
- The filtered chart itself (purple highlight). The chart is filtered by the selected item, meaning that it now only shows data relevant to the selection.
- Select an additional hierarchy or member element by holding down
CTRLand clicking another slice, legend, row, or cell. This selected item is now added to the filter, meaning that the cross-filtered discovery shows multiple items in the breadcrumb trail and is filtered to show the combined results of both selections.
Note: The preceding process assumes that a standard Single click / touch selection in your User Defaults is set to Highlight. If not, you can use right-click Data Interactions > Interact to perform the same filtering task.
It is important to note that cross-filtering applies to all discoveries that have an incoming interaction from the selected source and do not contain a hierarchy or an element that exists in the selected discovery. If the target discovery contains the element selected from the source discovery, cross-highlighting is applied as described above.